I also have a list of SEO tools that I go back to time and time again. However, most of us (myself included) still forget one of the most used SEO tools of all, something that most of us use every day without thinking twice.
And guess what? You won’t even have to click out of your browser to use it, because they’re the tools that are already part of your browser! (I probably didn’t need all that buildup with that title )
That’s right, Google Chrome – the world’s most utilized web browser at the moment – has a whole host of Developer Tools built right in, perfect for technical SEO analysis and testing. Just click the Chrome menu button, and under ‘More tools’ you’ll find ‘Developer Tools’ (or, for those who prefer keyboard shortcuts, hit Ctrl+Shift+I on a PC / Command+Option+I on a Mac). You can also right click on the page and select ‘Inspect’ to bring up developer tools.
Today I have put together a list of the most useful and often overlooked Chrome shortcuts for technical SEOs – it might take 5-10 minutes to go through this cheat sheet, but you’ll save hours of time working in the long run.
1. Switch your Reported Location in Chrome
As an SEO you often have to work by looking at things from specific locations in order to see how, for instance, a visitor in Australia sees your site as opposed to a visitor in America. Typically, most SEOs will download a VPN add-on to Chrome, but did you know that you can actually modify your location in Developer Tools.
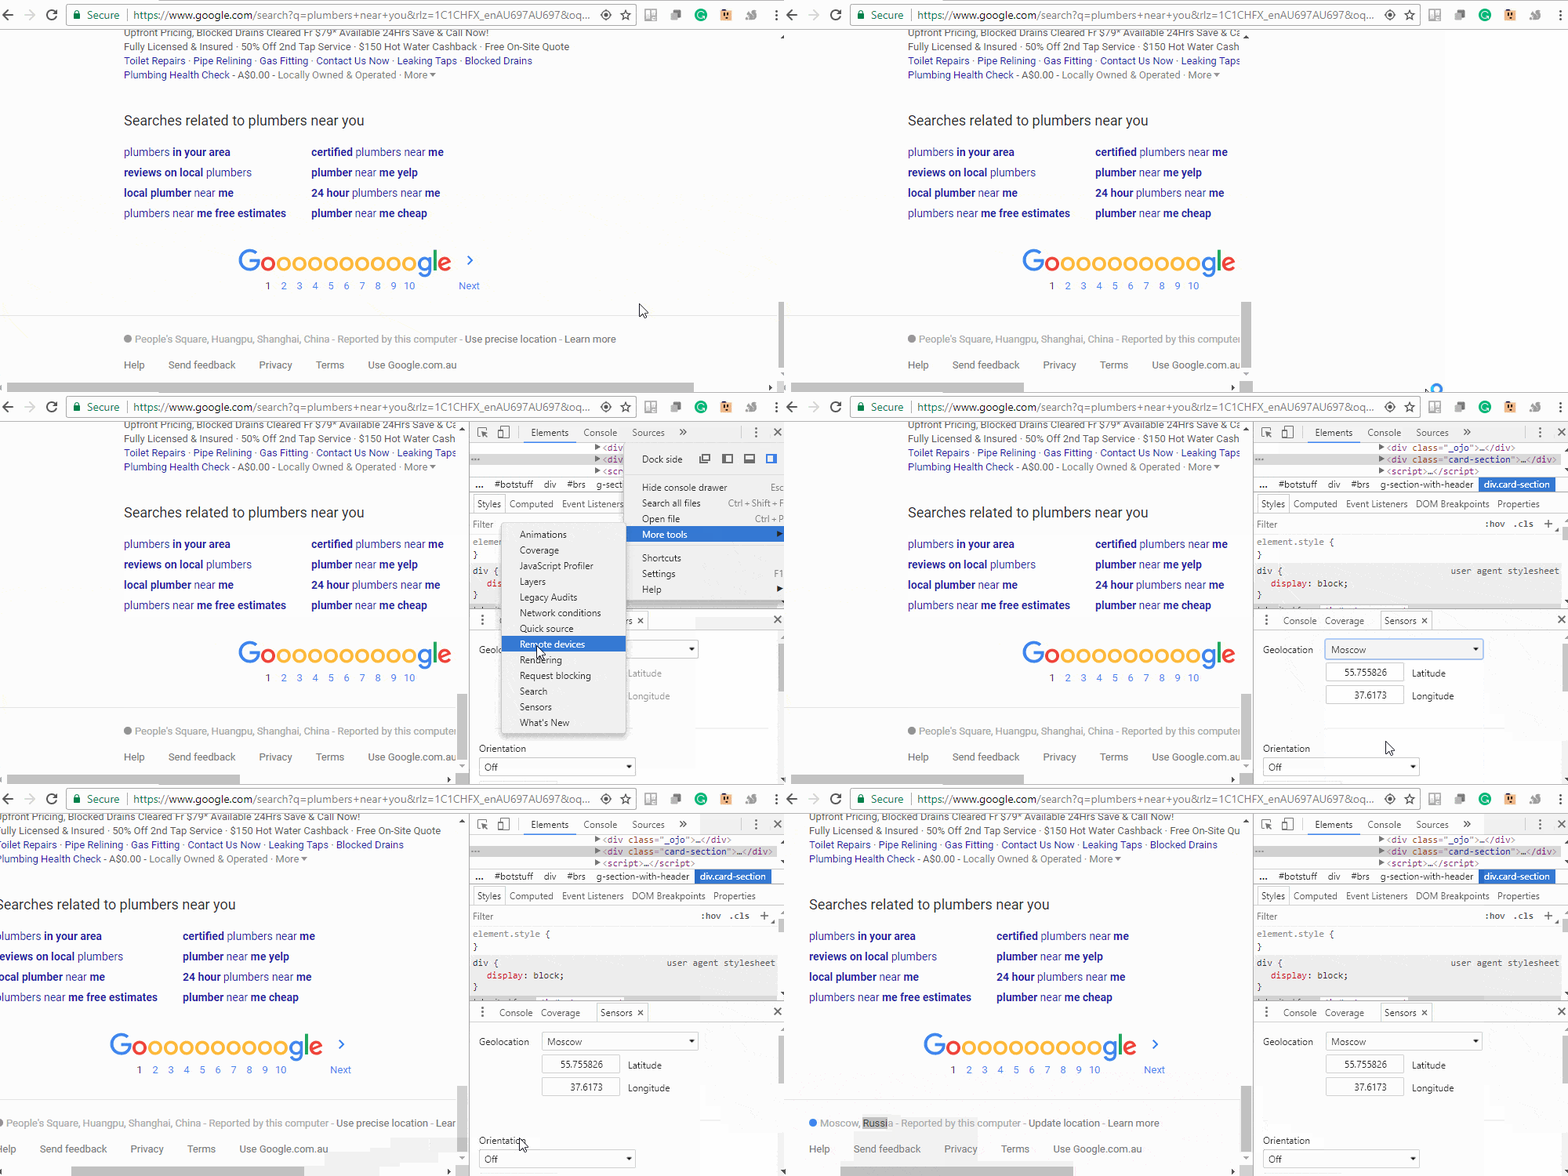
a. After you launch developer tools.
b. Select the three vertical dots near the close button.
c. Look for ‘More tools’ >> ‘Sensors’.
d. Here you’ll find a drop-down menu next to ‘Geolocation’ settings – select the country you want to view your site as and go.
You can also add Latitude and Longitude coordinates for more precise targeting.
2. Take a Full Size Screenshots of a Webpage in Chrome
Did you know Google Chrome has a built-in Screenshot function? Easily accessible through the Developer Tools kit in Inspect Element mode, it’s a great way to quickly grabs snaps of your site to give an overview of edits to your design team. When you want to take a full site screenshot:
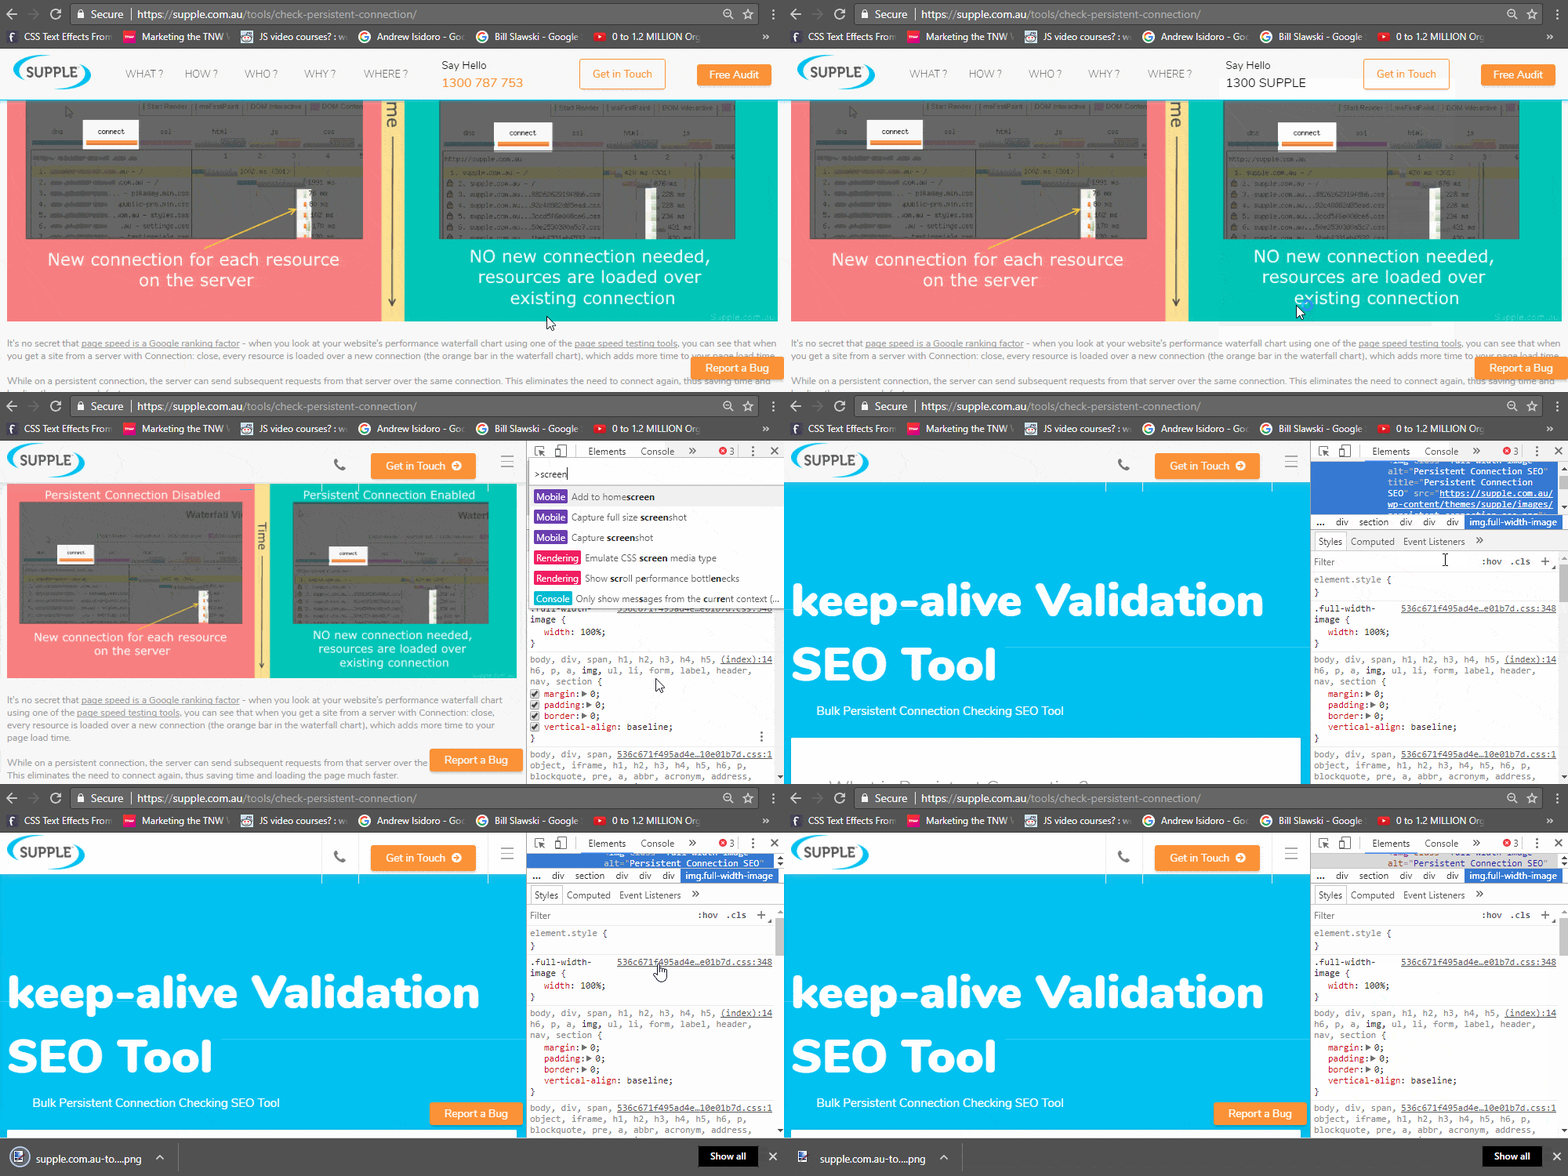
a. Open up the Developer Tools from that page.
b. Hit (Ctrl+Shift+P on a PC / Command+Option+P on a Mac) to load up the DevTools Command Menu.
c. Type in Screenshot and click on ‘Capture full-size screenshot’.
d. The screenshot will be added to your downloads folder.
3. Switch your User Agent in Chrome
Being an SEO, you may want to check how various visitors or bots see and interact with your website. While extensions like User-Agent Switcher are popular in the Chrome web store, you can switch it yourself without any extensions by:

a. Bringing up the Developer Tools view.
b. Select the three vertical dots near the close button.
c. Look for ‘More Tools’ >> ‘Network Conditions’.
d. Here you’ll find an option for User Agent, uncheck ‘Select automatically’.
e. From there, you’ll see the option to pick a pre-configured user agent from the dropdown or input your own custom UA string. Voila! Total control over user agent settings.
Fun Tip: Did you notice how the same page looks different on those two devices? On an Android the blockquotes look like Android SMS blocks and on an iPhone, they look like they are SMS bubbles from iOS (that article was a few years old so it was mimicking the OS design from that time). It’s probably a good idea for them to look into the Vary: User-Agent header response for that page from an SEO point of view.
Pro Tip: You can emulate Network throttling from this screen, it’s great if you want to see how users from places with iffy network connectivity will see your webpages.
4. See Mobile and Tablet View from Chrome
Seeing how your website looks and loads across different devices is a fundamental step in making sure you deliver a good, optimized user experience. Well, Developer Tools allows you to toggle ‘Device Mode’ under the little icon of a smartphone in the top left-hand corner of the DevTools menu. If you’re troubleshooting responsiveness and mobile optimization across multiple platforms, it’s time-consuming and impractical to literally have all your devices open in front of you. With ‘Device Mode’, quick shifts are a simple click away. You can view the page on a range of predefined devices or add a custom screen size. You can also emulate CPU throttling for low-end or mid-tiered mobile devices and switch between landscape and portrait mode.
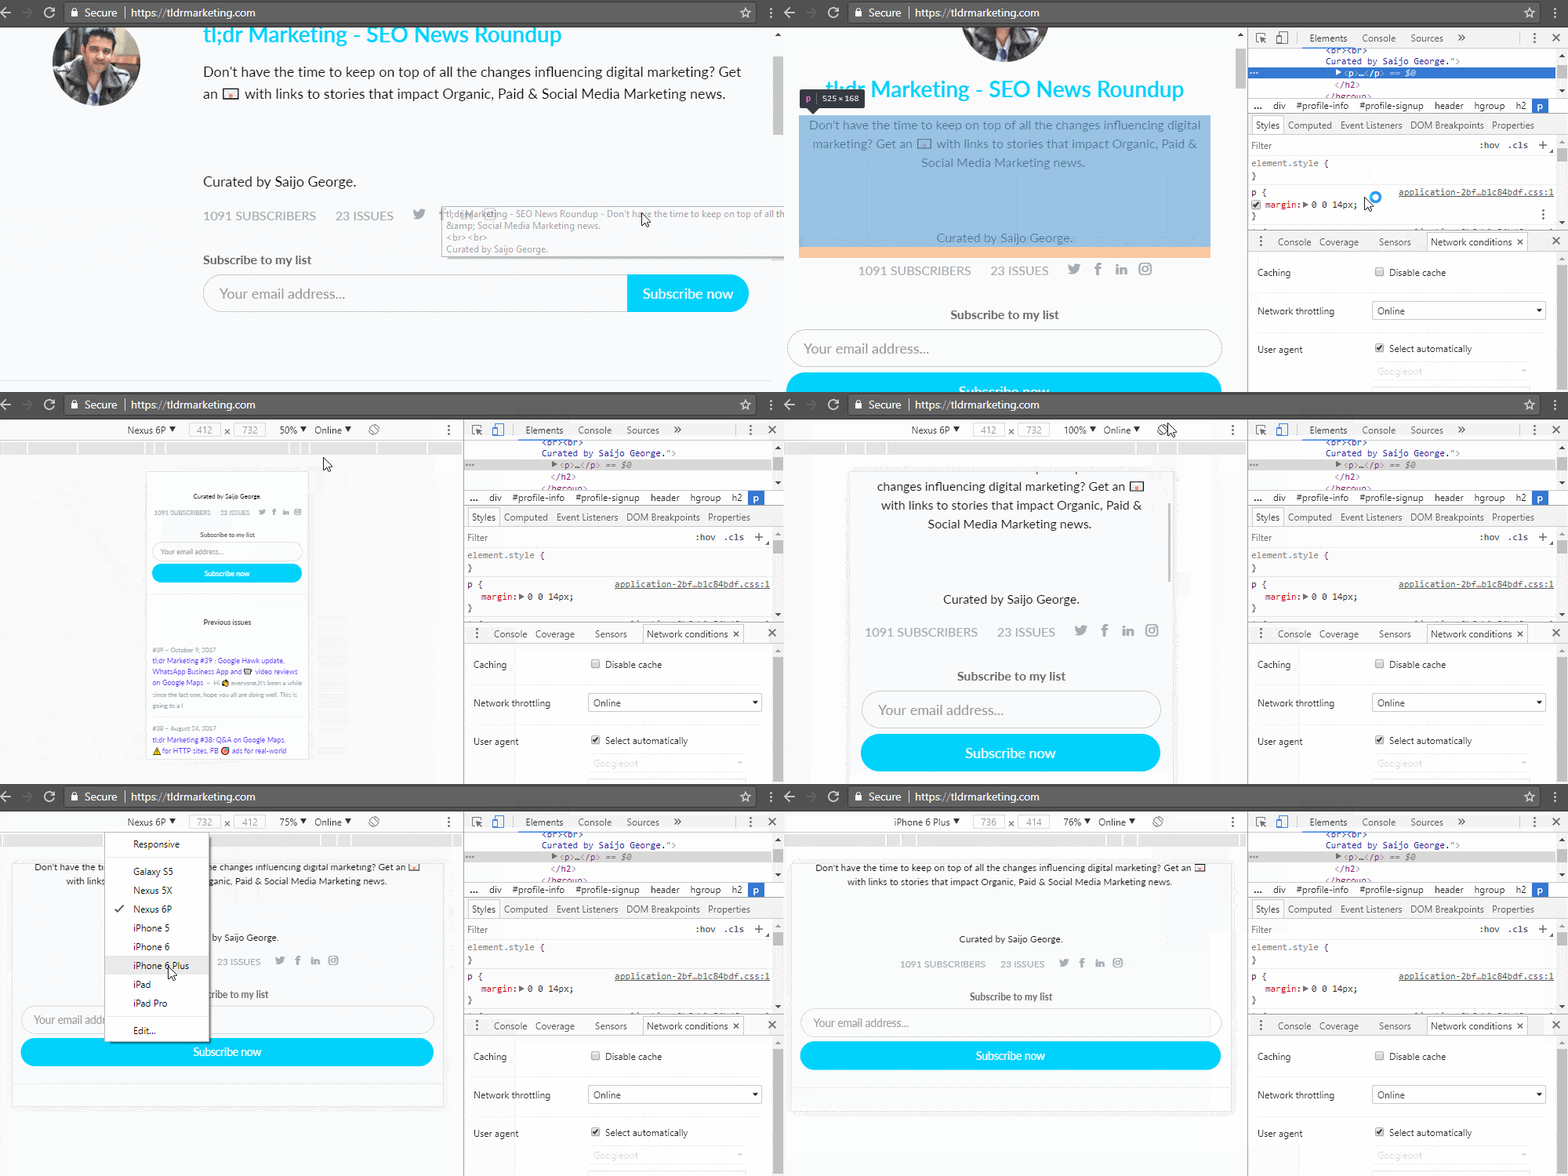
a. Bringing up the Developer Tools view.
b. Click the little icon of a smartphone/tablet in the top left-hand corner.
c. Pick your desired device from the drop-down.
d. Optional: you can click Rotate to rotate the viewport to landscape orientation.
5. View the HTTP Header in Chrome
Working on more technical SEO, it’s important to get a quick look at the header response by the server. Is the page sending the correct header response? Is it redirecting to a different page? Is a canonical specified in the header? These are all things you can answer by looking at the header response – and wouldn’t you know, you can see the header response in Chrome by:
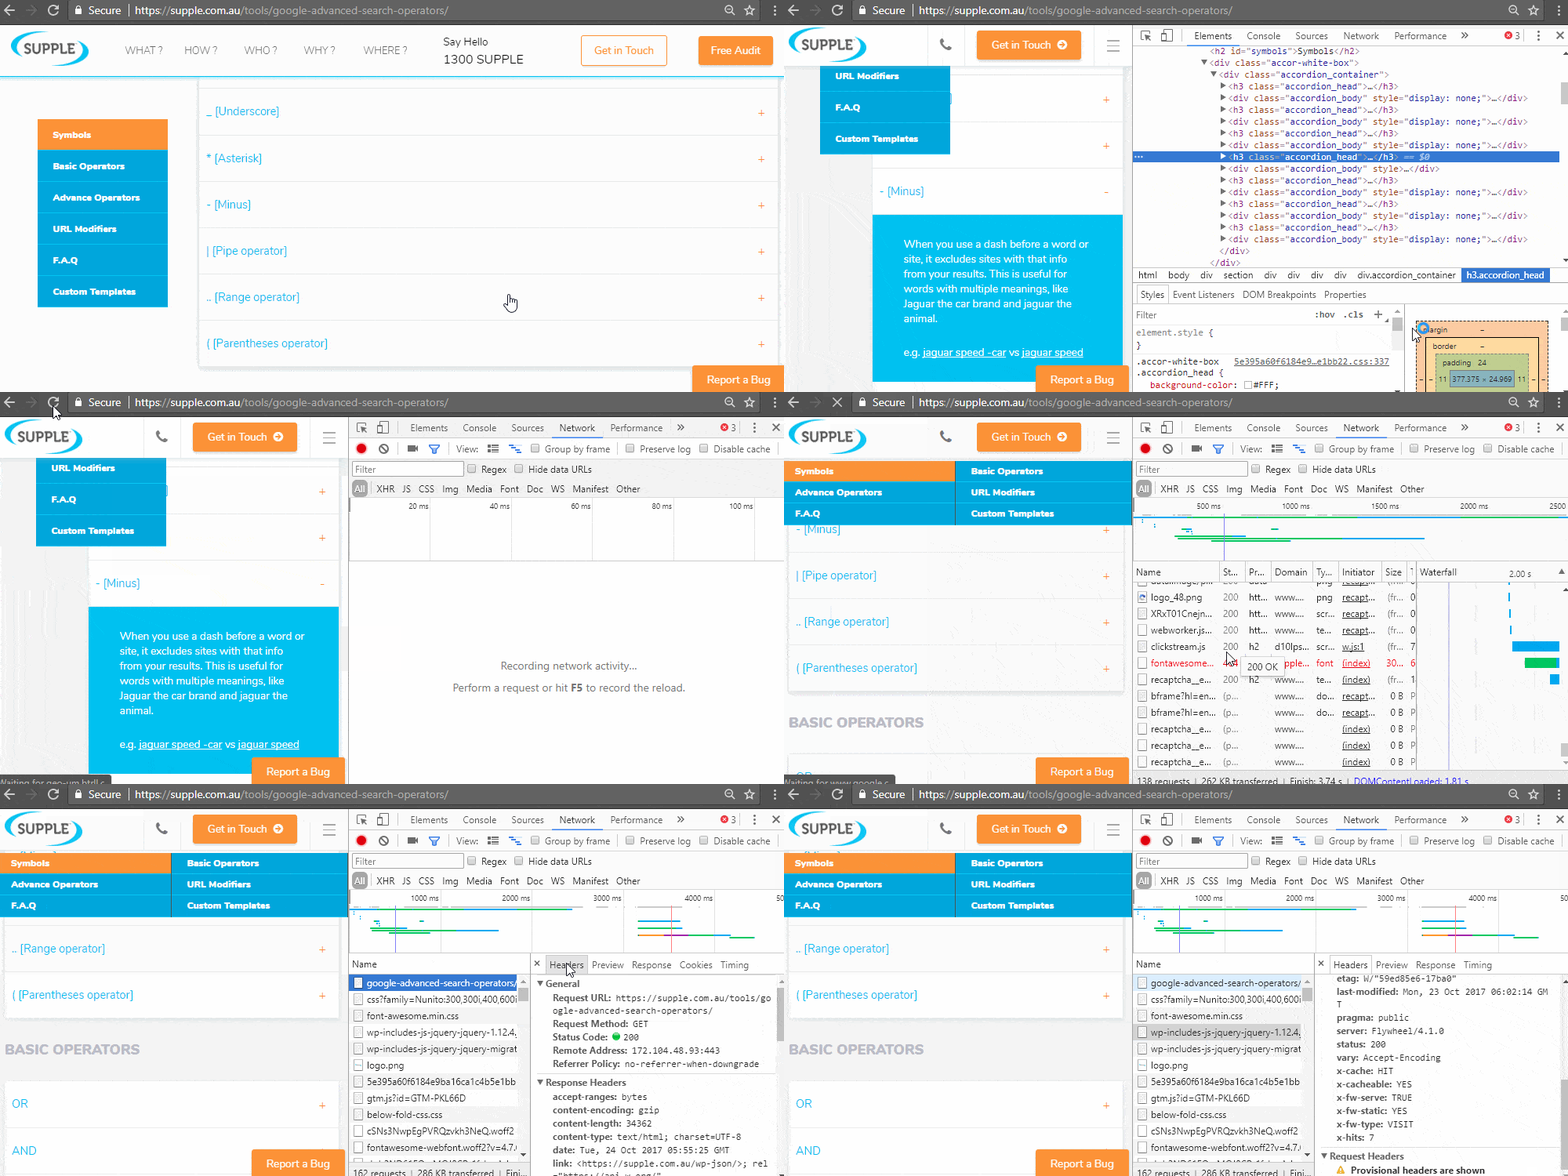
a. Bringing up the Developer Tools view.
b. Click the ‘Network’ tab and reload your page – all the requested asset will appear in a list on the left of the menu.
c. Pick your desired asset and you can see the header response for it (it is usually the default tab, if not click on Headers).
6. Look at the Network Waterfall View in Chrome
While you’re in the Network menu in Developer Tools view, you’ll notice a column displaying network waterfall modeling. This is a visual overview detailing the loading speeds of individual resources needed to display a website. This can be done by simply:
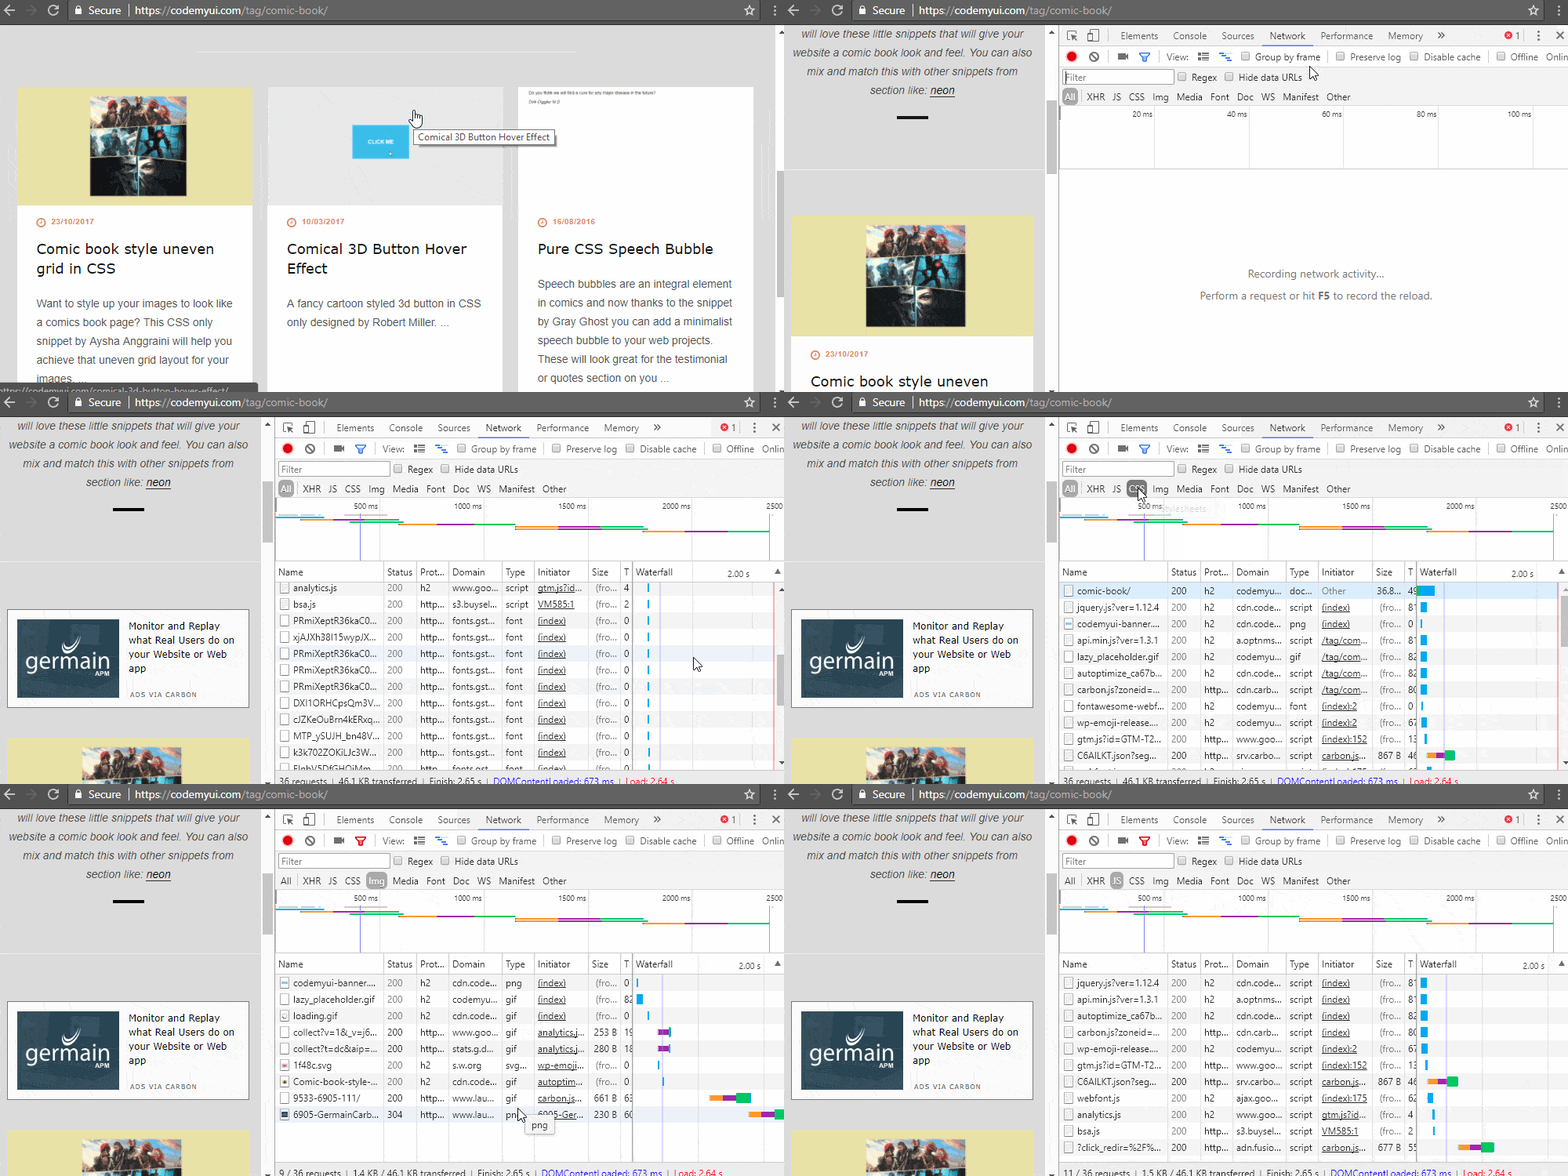
a. Bringing up the Developer Tools view.
b. Click the ‘Network’ tab and reload your page – all the requested asset will appear along with the network waterfall view.
c. You can easily filter these requests by domain, type, the protocol used, etc
Why is this useful? Well, Network Waterfall Modelling is a useful way to diagnose performance issues on your site. Issues are visually apparent under the waterfall format, helping you identify images that are loading too slowly, identify render block scripts or even see if assets are making multiple connection requests, etc.
Having this information makes it easier to prioritize what loads first to streamline user experience.
7. Performance Audits on Chrome
There are plenty of 3rd party tools out there for quick performance audits of your site, including Google PageSpeed Insights, WebPageTest, Pingdom Tools and countless others. Lighthouse is Google’s open-source answer to auditing tools, including specific audits for “performance, accessibility, progressive web apps and more”. Well, guess what – Google Lighthouse is baked into Chrome itself. To access it, start by:

a. Bringing up the Developer Tools view.
b. Click the ‘Audits’ tab and you have the option to tick boxes checking for meeting the standards of a Progressive Web App, whether it meets Google’s “best practices” standards, how it performs and its accessibility for disabled internet users.
8. Beautify Code for Debugging on Chrome
While minified code is great from a performance point of view, it’s a real pain when looking at the code to try and figure out what it does. But don’t worry – Google’s got you covered. There’s a handy feature in Chrome Developer Tools that lets you un-minify (or “beautify”) the code. This means the code will be indented and separated into clearly defined sections so it’s easier to understand for needing to make technical adjustments.It’s easy to beautify your site’s code by:
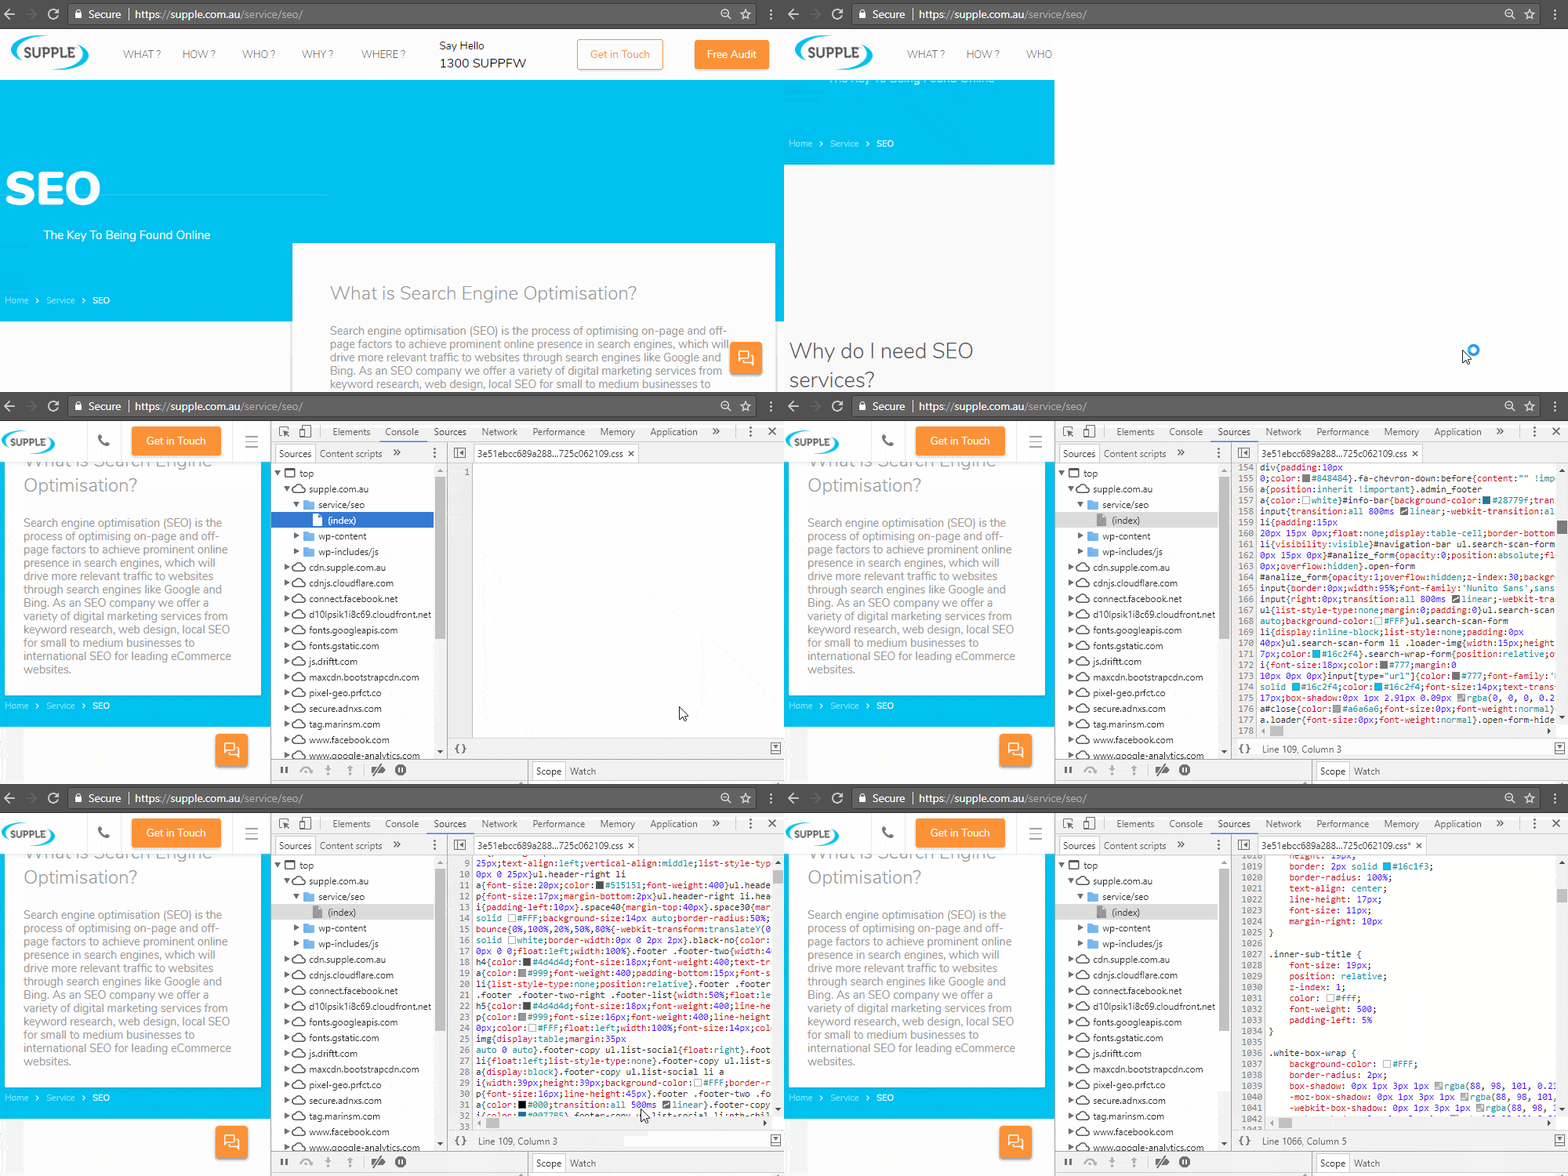
a. Bringing up the Developer Tools view.
b. Click on any asset that is minified like CSS, JS or HTML.
c. A new panel loads up the content and you will see 2 curly brackets {} at the bottom left of that panel. Click on that and Chrome will beautify you minified code.
9. Quick Check if a Web Server Supports HTTP/2
There are a lot of plugins available that can tell you if a server supports HTTP/2. Hey, we even made a bulk persistent connection checker. This can tell you if the server supports HTTP/2 amongst other things. But, truth be told, if you’re happy getting into Developer Tools view (which I assume you are if you’ve made it this far in this list) you can just use that. Start by:
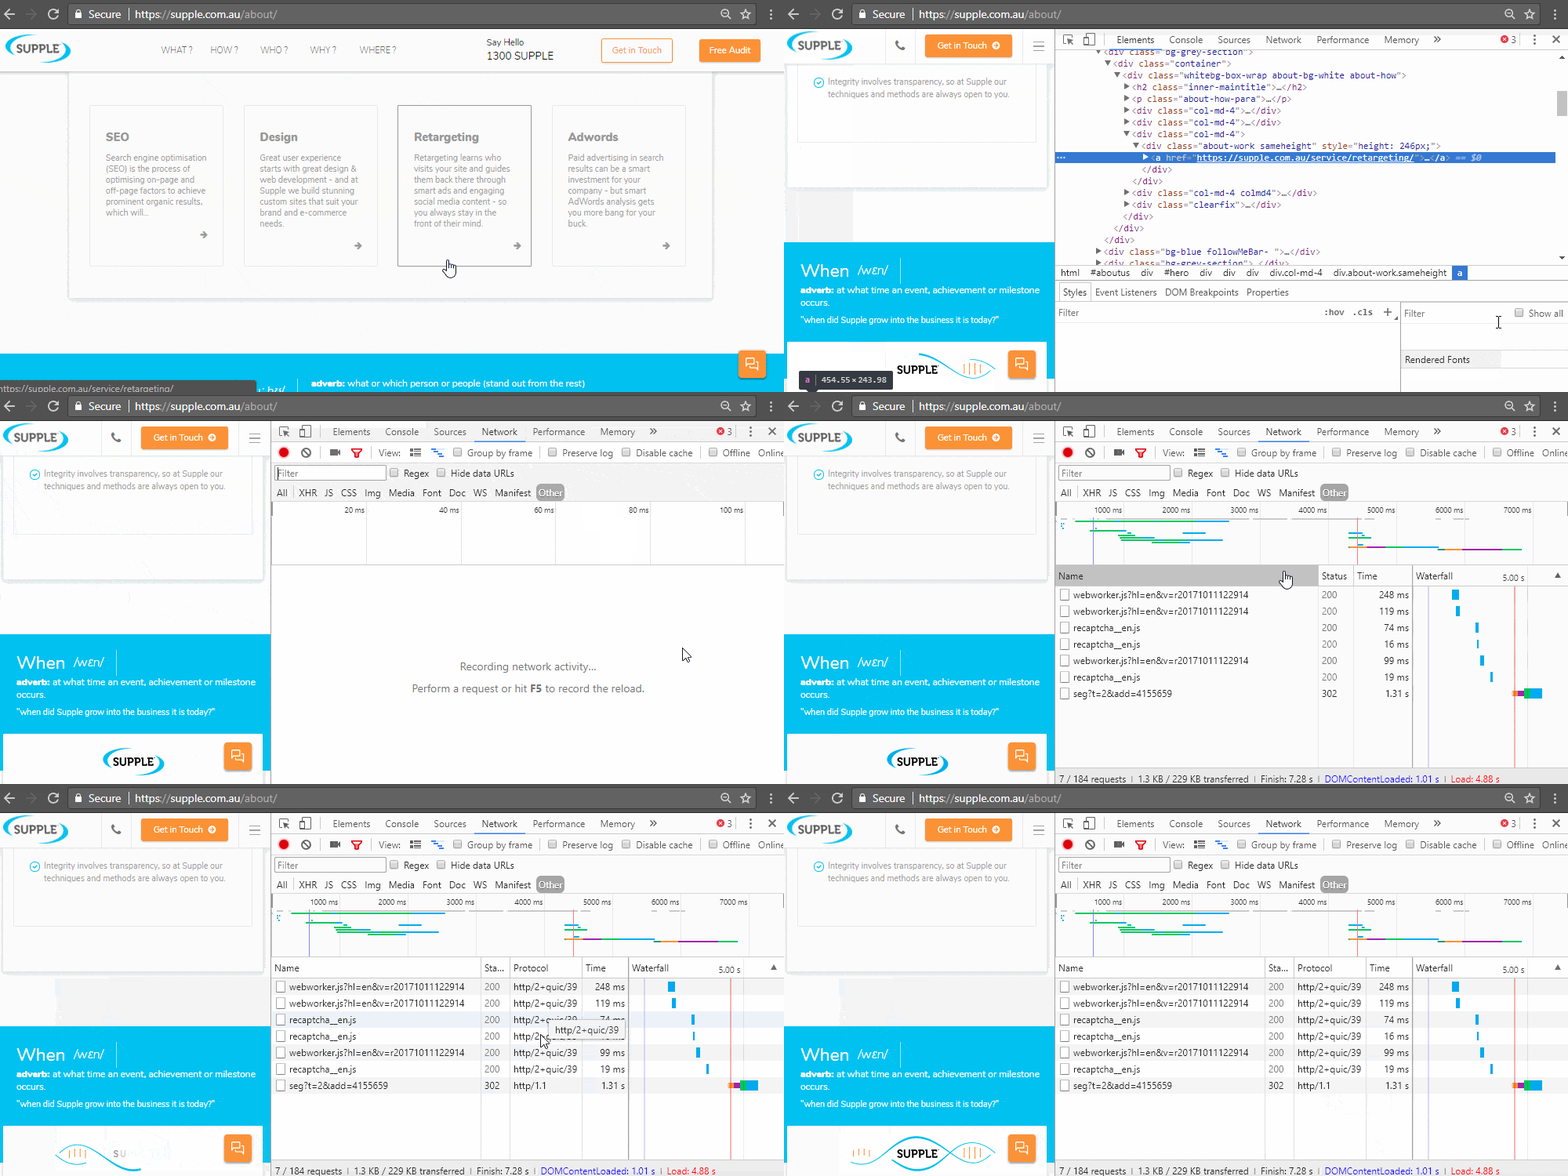
a. Bringing up the Developer Tools view.
b. Click on the ‘Network’ tab and reload the page.
c. You’ll need to add the ‘Protocol’ column to your Network tab (if it’s missing) – which is pretty easy, just right click on one of the headings under Network (like Name or our old friend Waterfall) to toggle quick columns that appear under the Network tab.
d. Select ‘Protocol’ and you’ll be able to read if a server supports HTTP/2 whenever you go to the Network tab.
10. Product Grouping in Chrome
Sometimes you want something a bit easier than an entire list of all the different resources a site is loading. Well, Developer Tools has a ‘Product Grouping’ view option which breaks those resources up into clear groups, based on the domain, type of resource, etc. To see these:

a. Bring up the Developer Tools view.
b. Click on the ‘Network’ tab and reload the page.
c. I usually have the ‘Domain’ and ‘Type’ columns enabled, just right-click on one of the headings under Network and pick the ones you want.
d. You can left click on those titles to sort the columns in ascending or descending order.
11. Make Scraping Easier with Chrome
Scraping is the bread and butter of a technical SEO, but working with xpath can be a bit tedious. But did you know Chrome can easily generate the xpath for any elements you see on-page in a couple of clicks, making your life that much easier.
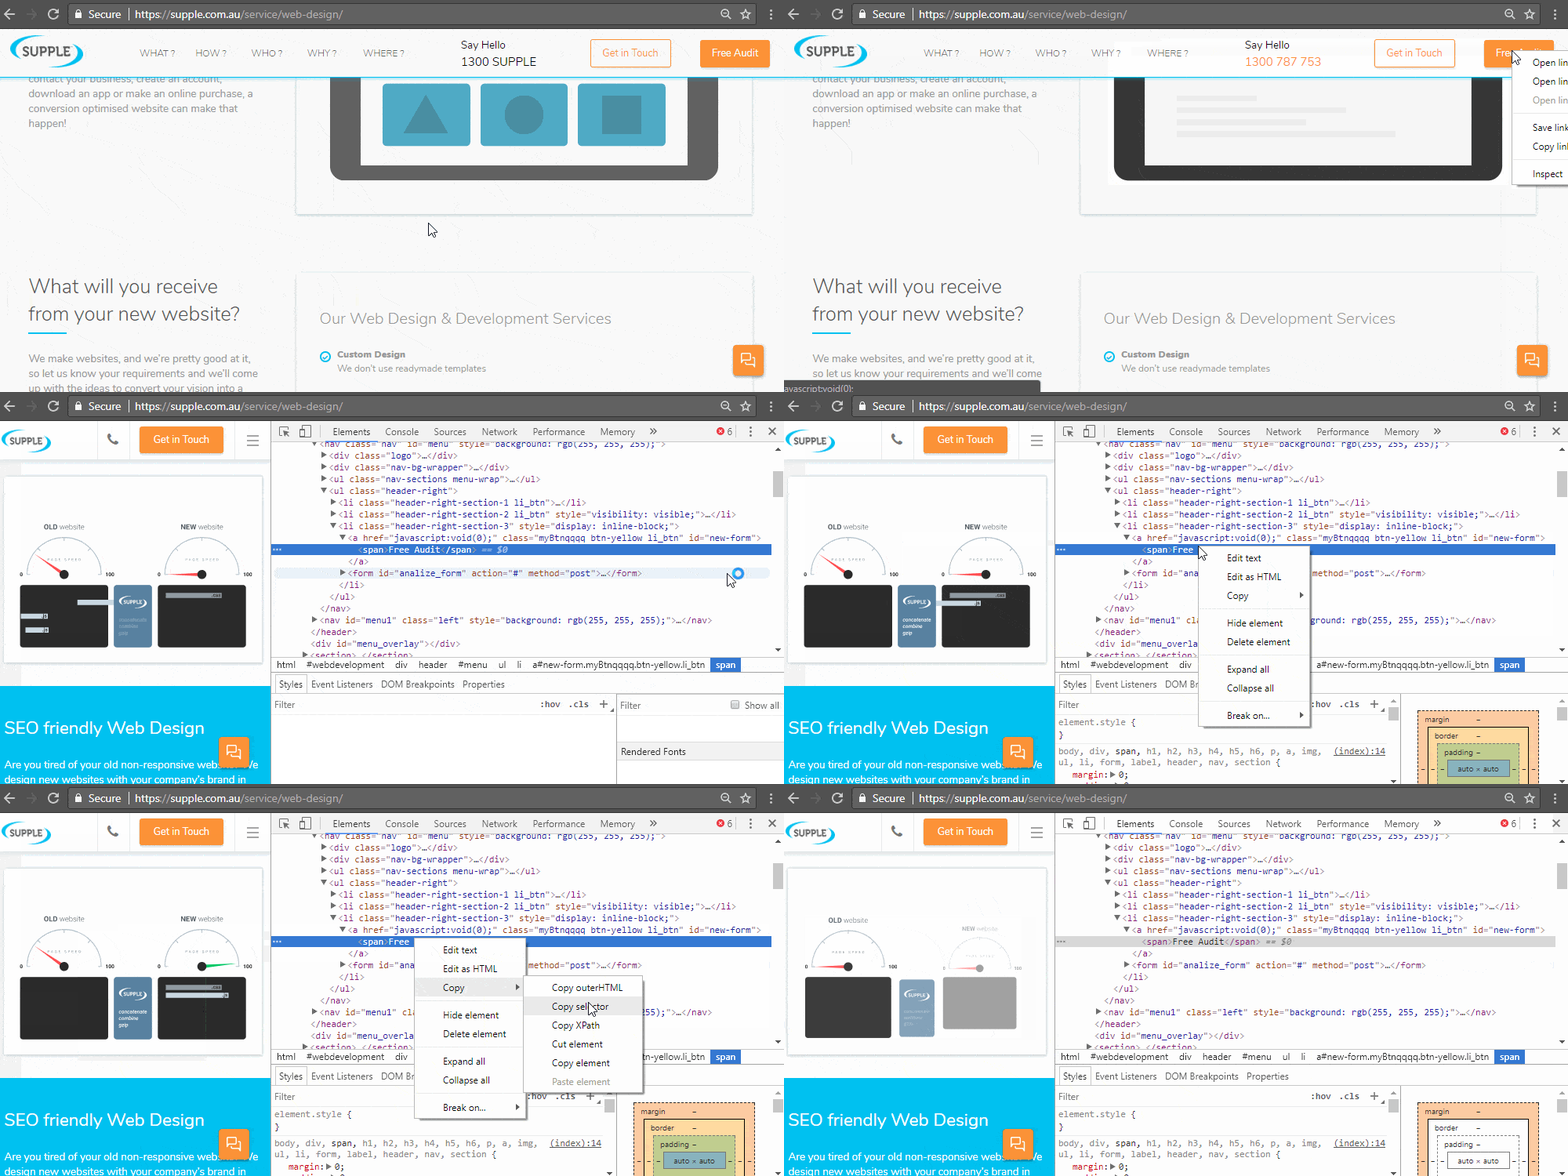
a. Right-click the element on the page that you want the xpath for and select ‘Inspect’.
b. The element’s HTML should be highlighted in the Developer Tools panel. Right-click that HTML and select Copy >> Copy XPath, the xpath gets copied to your clipboard.
12. Identifying Dead Code in Your Pages
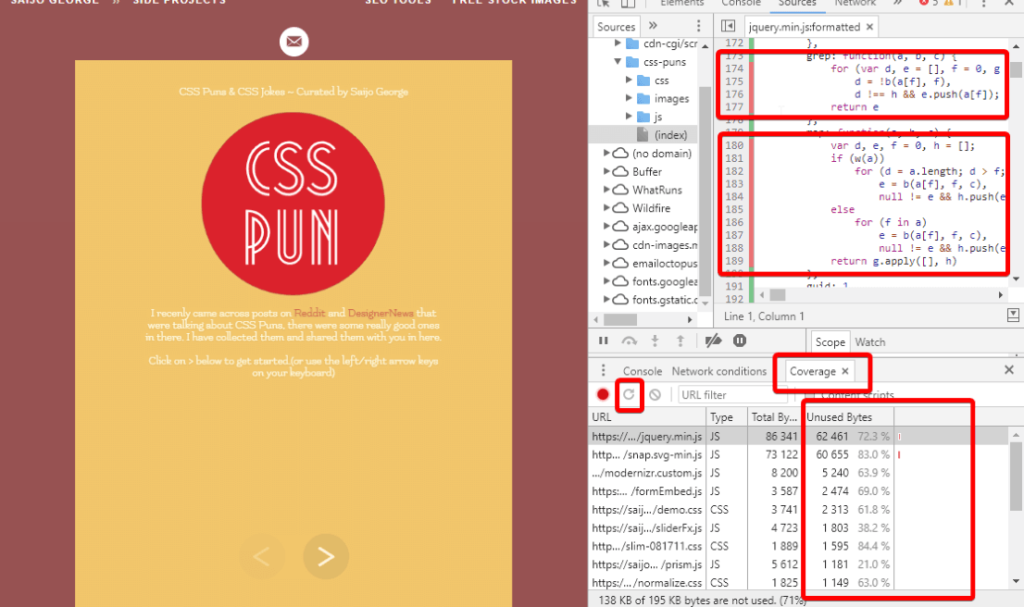
At times your CSS and JS files will have a lot of extra code that is not used on the page, if you care about improving the performance of your web page (which every SEO would) then it’s a good idea to get rid of that code from those pages and only use that where it’s needed. Thankfully there is a new feature in Chrome called coverage report that helps you with this.
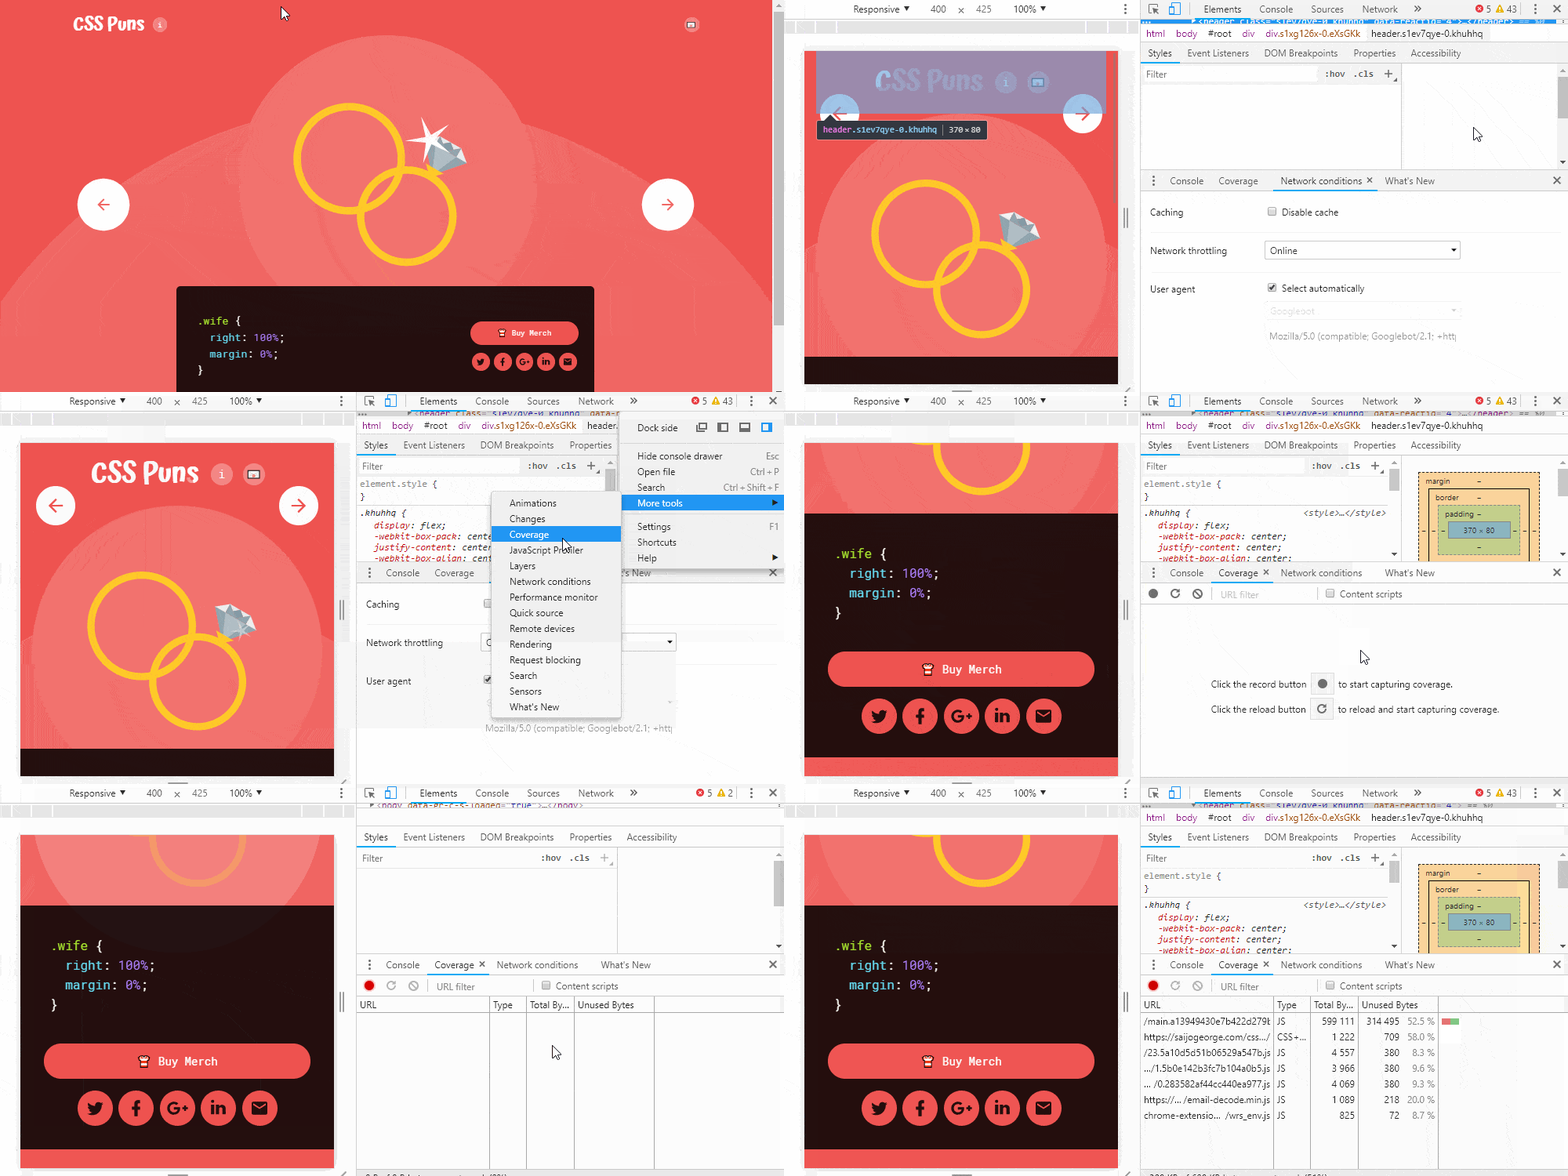
a. Bringing up the Developer Tools view.
b. Select the three vertical dots near the close button.
c. Look for ‘More tools’ >> ‘Coverage’.
d. Click on the ‘Reload’ icon.
e. You can now see the % of unused CSS and JS in the loaded files, you can click on one of them and it will show you the used and unused lines of code in green and red, respectively.
These are just a few of the amazing tools readily available by delving into the Developer Tools view of Chrome. Reading this, you may have realized you have quite a few extensions and plugins you can now delete.
What are your favorite Chrome Developer tools tips and tricks? Let me know in the comments below so we can all learn to make the most of Chrome together.

